The Benchmark That Does Not Exist: What One Fake HVAC Statistic Says About Industry Data
Search for an HVAC profitability benchmark and one number appears everywhere: a median net margin of 5.8 percent, top quartile 13.2 percent, attributed to a 2024 ACCA financial benchmarking study. Dozens of industry sites cite it. Consultants quote it. Owners measure themselves against it.
A study by that name does not appear in ACCA’s published catalog. The association’s most recent financial benchmarking survey covers 2020 data from 302 companies. The 5.8 percent figure circulates through articles citing other articles, a loop with no primary source at the bottom. Hold it to the standard for real benchmarks, meaning a named study with a disclosed sample and methodology, and the conclusion is stark. There is currently no credible published net margin benchmark for United States HVAC contractors at all.
This is not unique to one trade. Fabricated benchmarks propagate wherever content farms need a number and nobody checks the citation. The interesting question is what an owner should do when the industry’s reference data dissolves under inspection.
What Survives Verification
Hold HVAC statistics to the standard of a government statistical program or an association survey with published methodology, and the shelf is nearly bare. Bureau of Labor Statistics data puts field labor wages at $41.72 per hour, up 7.1 percent year over year. Census data counts 111,207 establishments, 68.5 percent of them under five employees.
So wages and industry structure are verified. Margin, close rate, average ticket, callback rate: nothing that clears the bar.
That leaves owners bidding against competitors, and against their own history, using folklore. The alternative is not better googling. It is measurement inside the business, which no citation loop can corrupt.
Testing the Alternative Against Real Tools
A fictional composite goes through the full diagnostic process below. Commercial HVAC Service Company runs about $6M with 24 people. Job-level margin stays unknown until the accountant closes the quarter, maintenance agreements are priced off a decade-old rule of thumb, and no baseline exists for callback rate or first-time fix.
Every detail is invented, built to represent the owner who went looking for the benchmark above. The tool output is real. The VWCG Strategic Assessment returns a scored briefing from structured inputs. The businessconsultant.services diagnostic returns a written analysis from a plain-language description.
What the Assessment Found
The SWOT page shows what benchmark hunting was standing in for.
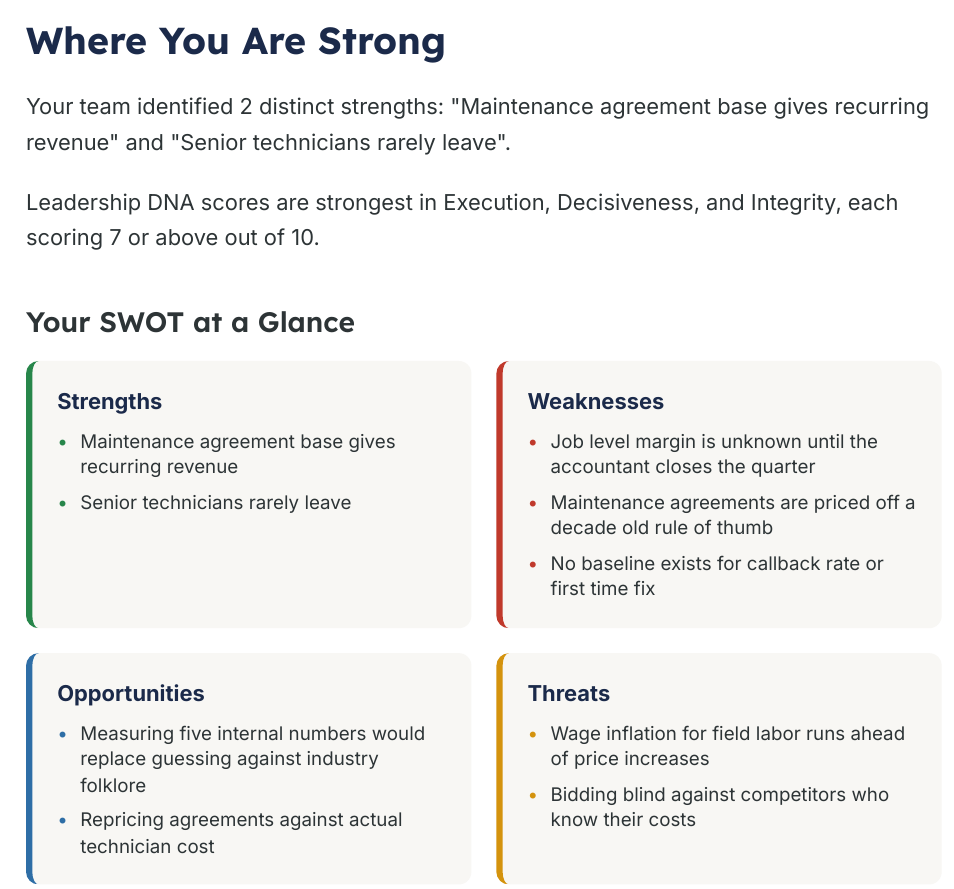
The strengths are real: a maintenance agreement base gives recurring revenue, and senior technicians rarely leave.
The weaknesses are all measurement. Job-level margin is unknown until the accountant closes the quarter. Maintenance agreements are priced off a decade-old rule of thumb. No baseline exists for callback rate or first-time fix.
The threat column explains the urgency without any industry average. Wage inflation for field labor runs ahead of price increases, and the company is bidding blind against competitors who know their costs. The opportunity column states the thesis of this article in twelve words: measuring five internal numbers would replace guessing against industry folklore.
The briefing’s benchmarking page models the honest way to use comparative data.
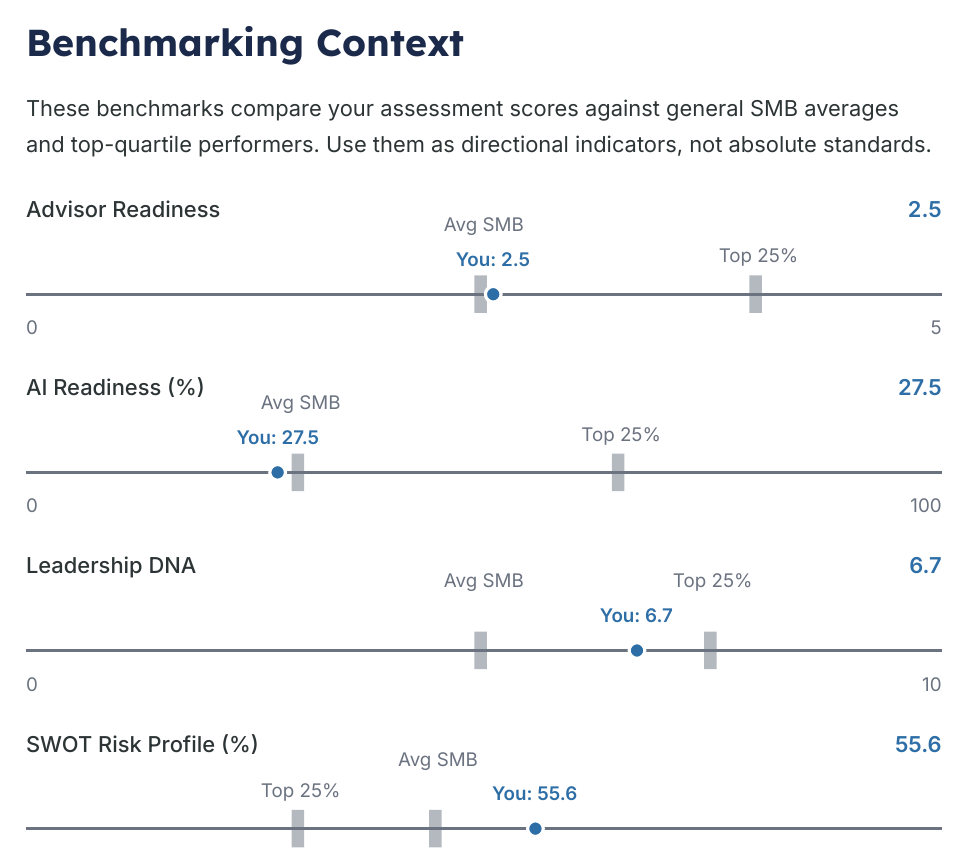
Every scale carries the same caution in the header: use them as directional indicators, not absolute standards. The persona lands at the SMB average on advisor readiness, below the top quartile on AI readiness at 27.5 percent, and above average on leadership. Directional, sourced, and labeled, which is exactly what the fake 5.8 percent figure is not.
What the Written Diagnostic Added
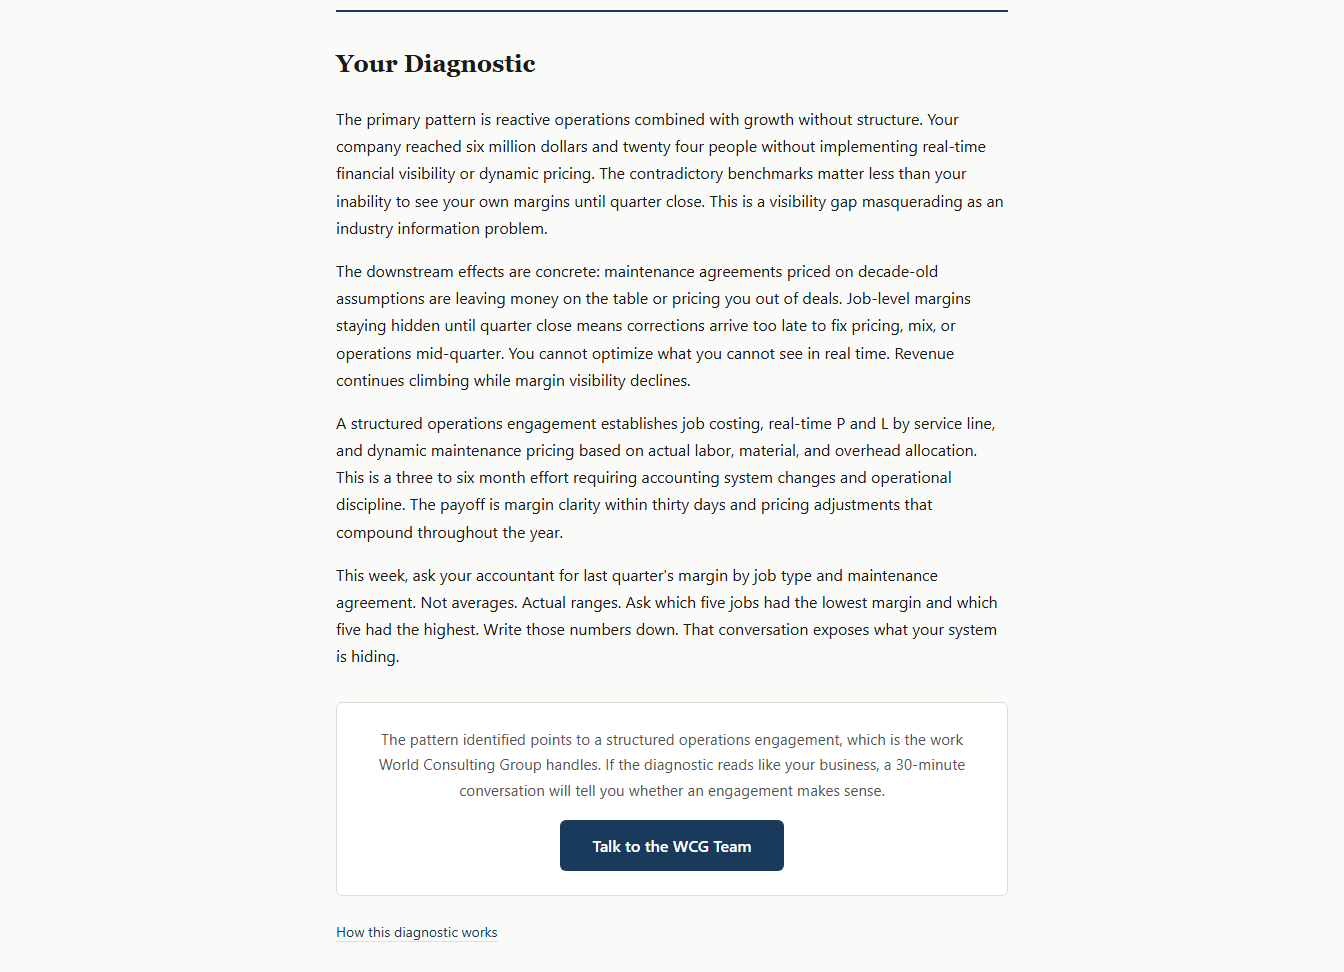
The written diagnostic cut the knot in one sentence. The contradictory benchmarks matter less than the inability to see internal margins until quarter close: this is a visibility gap masquerading as an industry information problem.
It priced the gap in operating terms. Agreements priced on decade-old assumptions are leaving money on the table or pricing the company out of deals. Margins hidden until quarter close mean corrections arrive too late to fix pricing, mix, or operations mid-quarter. Revenue keeps climbing while margin visibility declines, which is how a growing company gets poorer per job without noticing.
The homework requires no software. Ask the accountant for last quarter’s margin by job type and maintenance agreement. Not averages, actual ranges: the five lowest-margin jobs and the five highest.
Write those numbers down. That conversation exposes what the current system is hiding.
The Five Numbers That Replace the Fake One
Assembled from both outputs, this is the internal dashboard that makes industry folklore irrelevant.
Job-level margin at completion. Known when the job closes, not when the quarter does. This is the number the fake benchmark was pretending to substitute for.
Maintenance agreement margin against current technician cost. With field wages up 7.1 percent in a year, a decade-old price sheet is a standing discount nobody approved. Realistic cost breakdowns beat rules of thumb in every category of spend.
Callback rate. Every callback is unpaid labor plus wage inflation. A monthly baseline turns quality from a feeling into a trend.
First-time fix rate. The twin of callbacks on the revenue side: trucks that fix on the first visit sell the next agreement.
Labor cost per billed hour against bid assumptions. The gap between what estimates assume and what payroll pays is where blind bidding loses to competitors who measure. Maturity on these five is a better position marker than any maturity model label.
The 90-Day Sequence
Days 1 to 10. Have the accountant conversation exactly as prescribed. Ten jobs, real ranges, on paper.
Days 11 to 40. Add job-costing fields to the existing field service workflow: labor hours, materials, and allocated overhead per job. No new software until the categories exist.
Days 41 to 70. Reprice the maintenance agreement book against current technician cost, starting with the ten oldest agreements. Grandfather nothing that loses money.
Days 71 to 90. Publish the five-number dashboard monthly. The persona’s target, every job closing with a known margin, is the whole cure for benchmark hunting.
Run the Same Diagnosis on Your Business
The walkthrough used a fictional company. The tools accept real inputs and return the same class of findings, sourced and labeled. The VWCG Strategic Assessment takes about 10 minutes and scores the business against its own stated targets, which is the comparison that pays.
An industry that cites a study nobody can produce is telling owners something useful: the outside numbers were never going to run the business. The inside numbers will.
Kamyar Shah has led 650+ consulting engagements, including fractional COO, fractional CMO, executive coaching, and strategic advisory, producing over $300M in client impact across companies in the $1M-$50M range. He built the VWCG Strategic Assessment from the same diagnostic frameworks he uses in paid engagements.
Ready to assess your business?
Get clear visibility into your gaps with our free tools.
Start Free Assessment