The January Revenue Cliff: Why a Strong December Hides a Structural Problem
A small business owner posted this to r/smallbusiness in August 2026: “November and December are a blur, then January hits and it’s like someone turned off the lights. Foot traffic drops by more than half.” That owner runs a storefront. The pattern belongs to every business with a demand calendar it does not control.
Dental practices live an extreme version of it. Insurance benefits expire on December 31, so patients rush to book before year end, and December runs at capacity. Then January opens the year at half speed, hygiene chairs sit empty, and the practice draws on a line of credit to cover payroll.
The revenue did not disappear. It was never scheduled.
The usual advice treats this as a marketing problem. Run a January promotion, buy some ads, discount whitening. That advice fails because the cliff is not a demand problem. It is a structure problem, and structure problems show up on a diagnostic long before they show up on a P&L.
Testing the Question Against Real Tools
To show what that diagnosis looks like, a fictional composite practice goes through the full process below. General Dentistry Practice does about $1.8M with nine staff. Its December is packed with benefits-deadline patients, its hygiene recall runs on front desk memory, and it has no membership plan for uninsured patients.
Every detail is invented, built from the sourced complaint above. The tool output is real.
Two free tools produced the findings. The VWCG Strategic Assessment collects structured inputs across nine areas and returns a scored PDF briefing. The written diagnostic at businessconsultant.services takes a plain-language description and returns a pattern analysis.
Neither tool knows the practice is fictional. They only see the inputs.
What the Assessment Scored
The Strategic Business Assessment returned a 14-page briefing. The Executive Snapshot puts three numbers on the first content page.
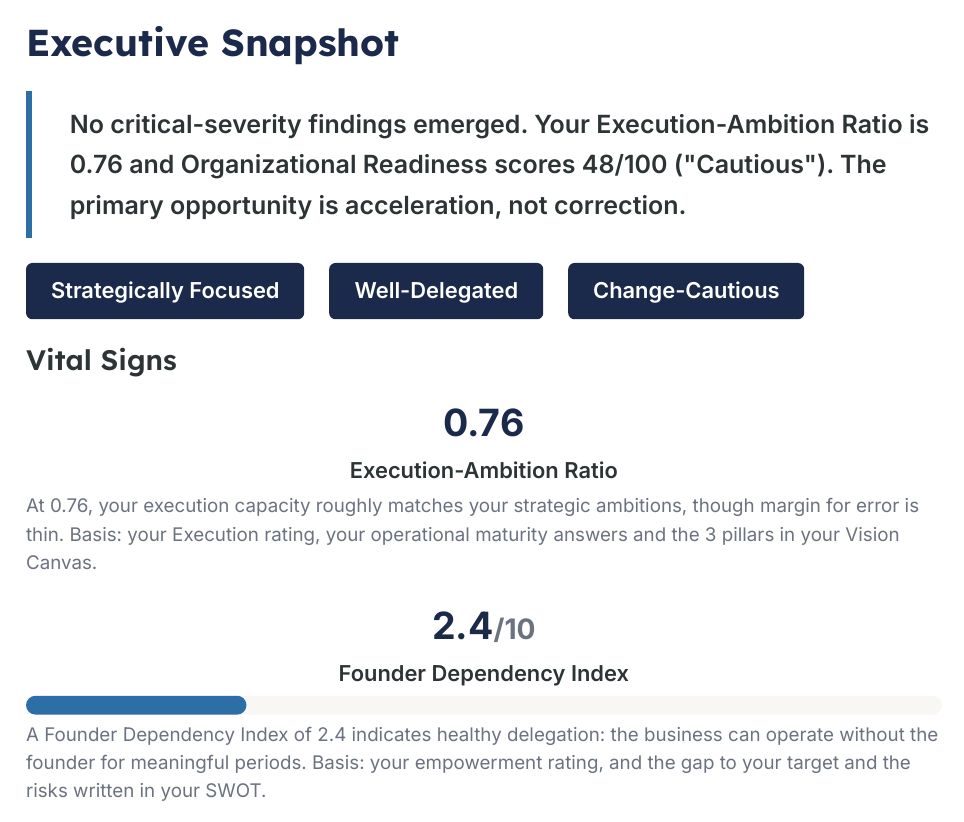
The Execution-Ambition Ratio of 0.76 says execution capacity roughly matches ambition, with thin margin for error. The Founder Dependency Index of 2.4 out of 10 indicates healthy delegation. Organizational Readiness lands at 48 out of 100, in the band the tool labels “Cautious.” The headline finding: no critical-severity findings emerged, and the primary opportunity is acceleration, not correction.
Read those three numbers together and the practice looks fine. That is exactly why owners miss the cliff. The damage lives one page deeper, in what the team itself reported.
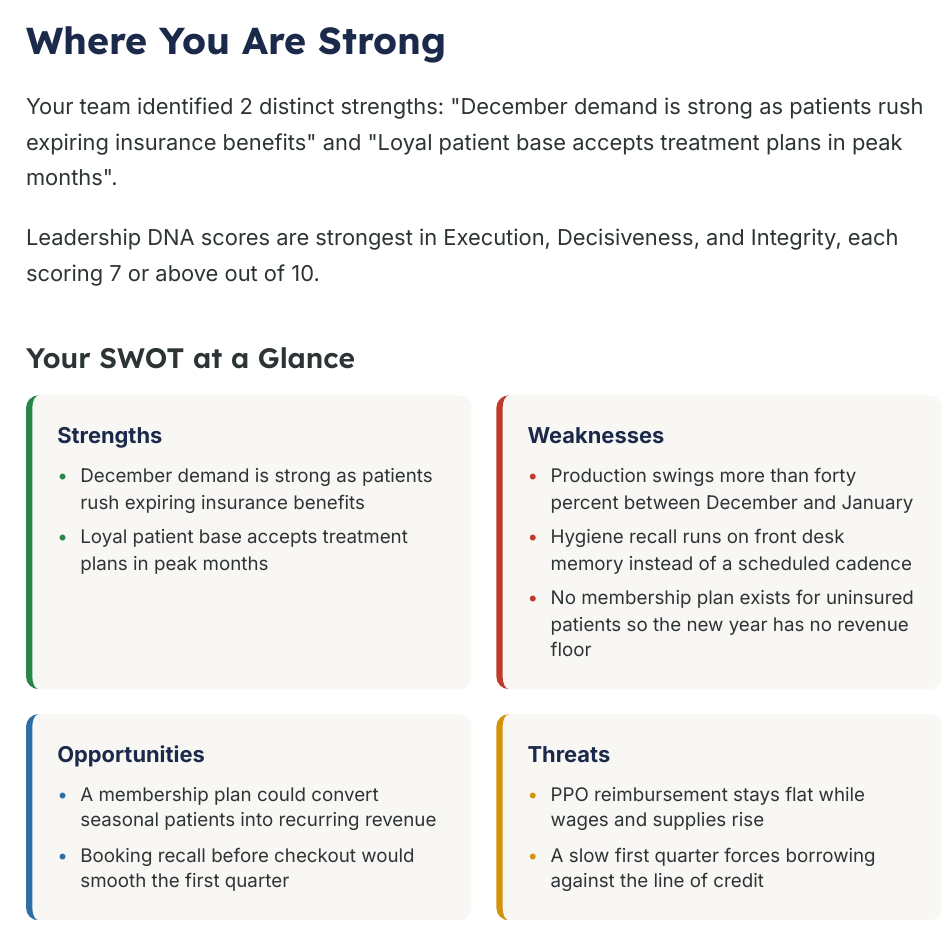
The SWOT page converts the owner’s own words into a risk map. Production swings more than forty percent between December and January. Hygiene recall runs on front desk memory instead of a scheduled cadence. No membership plan exists for uninsured patients, so the new year has no revenue floor.
The threat column completes the loop. PPO reimbursement stays flat while wages and supplies rise, and a slow first quarter forces borrowing against the line of credit.
Notice what happened. The owner typed a complaint about January. The assessment reframed it as three missing structures: a recall system, a revenue floor, and a first-quarter plan. None of those is a marketing purchase.
What the Written Diagnostic Added
The same fictional practice, described in five sentences of plain text, went through the businessconsultant.services diagnostic.
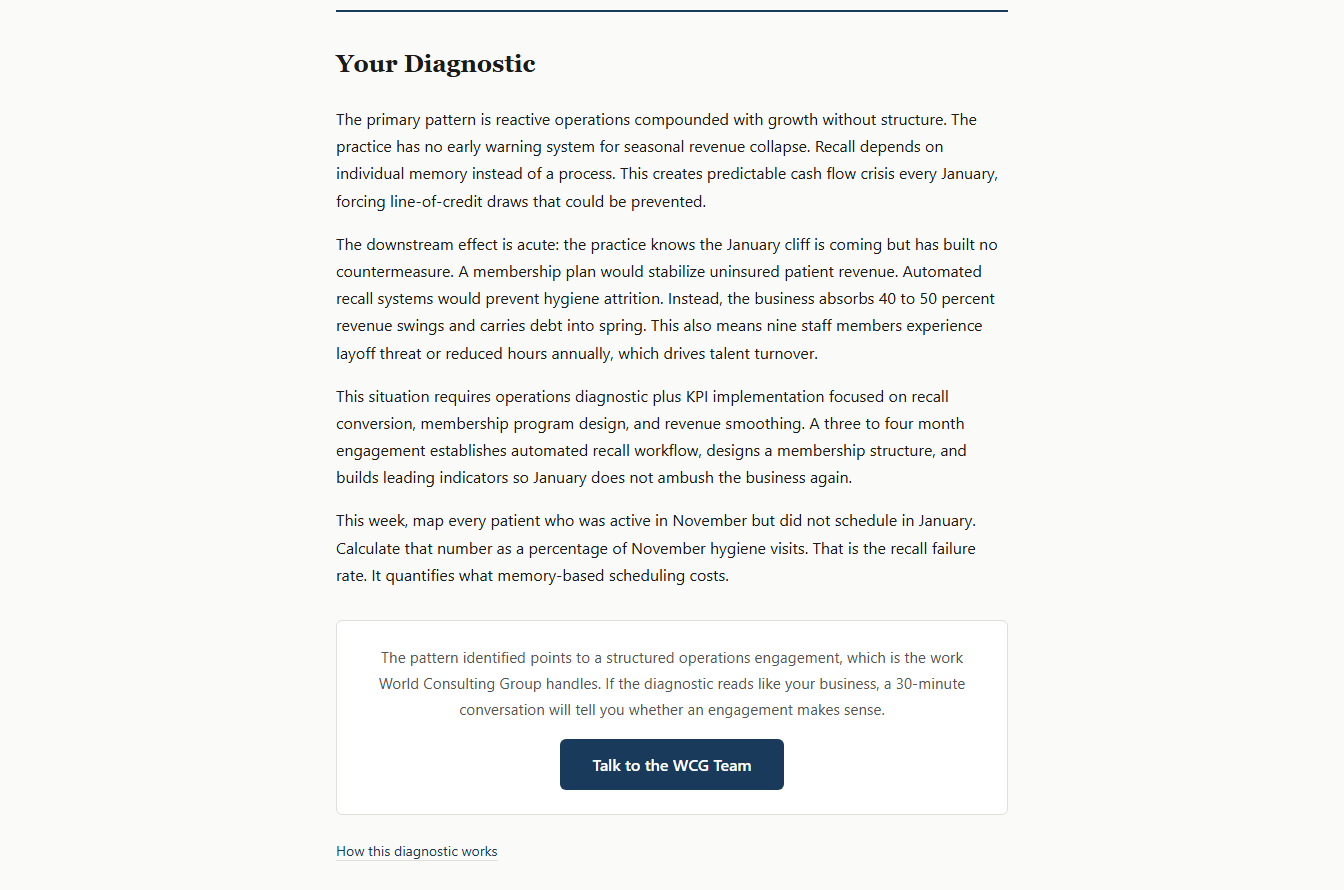
The diagnostic named the primary pattern: reactive operations compounded with growth without structure. It made the cost concrete. The practice knows the January cliff is coming and has built no countermeasure, so it absorbs 40 to 50 percent revenue swings and carries debt into spring.
The diagnostic also surfaced a second-order cost the owner never mentioned. Nine staff members experience reduced hours or layoff fear every winter, which quietly drives turnover.
Its homework assignment is the sharpest line in either report. Map every patient who was active in November but did not schedule in January, then divide by November hygiene visits. That is the recall failure rate. It quantifies what memory-based scheduling costs, in one number, from data the practice already owns.
Why the Score Says Fine While the Cash Says Otherwise
The snapshot verdict and the SWOT page look like they disagree. They do not, and the distinction matters for reading any diagnostic honestly. The headline scores measure the leadership system: delegation, decision speed, strategic focus. This practice delegates well and decides quickly, so those scores are healthy.
The cliff lives in the operating calendar, not in the leadership system. A well-led practice can still run its year on a schedule someone else controls. That is why the tool separates the two readings instead of blending them into one grade. An owner who saw only a composite score would file the whole report under fine and keep borrowing every February.
The practical lesson: read the weakness inventory before the headline number. The headline says how hard the fix will be. The inventory says what to fix.
The Answer the Tools Assembled
Put the two outputs together and the January cliff question has a specific answer with three parts.
Build the recall floor first. Recall booked before the patient leaves the building is the single highest-return fix, because it converts December’s crowd into January’s schedule. A practice at capacity in December is holding next quarter’s revenue in its own lobby. Documented processes that actually run beat reminder heroics from the front desk every time.
Install a revenue floor. A membership plan for uninsured patients converts seasonal visitors into recurring revenue, which is the only revenue that ignores the insurance calendar. The assessment listed it as the top opportunity. Pricing it takes an afternoon: annual cleaning and exam bundle at a modest discount to walk-in rates, billed monthly.
Plan the slow season during the busy one. The practice sets its January in November, not on January 2. The Vision Canvas target the persona set is month-to-month production variance under 15 percent. That is the right class of goal because it is measurable weekly and forces the other two structures into place.
The economics behind the urgency are not folklore. American Dental Association Health Policy Institute survey data shows dentist real net income fell from $267,168 in 2010 to $207,980 in 2024. A practice that finances a predictable January with a line of credit is paying interest to avoid building a schedule. The industry margin cushion has been shrinking for 15 years.
The 90-Day Sequence
The tools’ recommendations compress into a quarter-length plan any practice can run.
Days 1 to 15. Measure the recall failure rate exactly as the diagnostic prescribed. Pull November active patients, subtract January bookings, divide. Post the number where the whole team sees it.
Days 16 to 45. Move recall booking to checkout. The assistant walks the patient to the desk, the next hygiene visit goes on the calendar before payment. Track the before-checkout booking rate weekly. A business that cannot fund its own growth plan usually has scheduling debt, not demand debt.
Days 46 to 75. Launch the membership plan for uninsured patients. Start with the top 50 uninsured households by visit history. A 20 percent enrollment rate builds the first revenue floor the practice has ever had.
Days 76 to 90. Write the first-quarter plan for next year while this year’s data is fresh. December capacity, January targets, staffing levels, and the variance number reviewed monthly. Assign each number an owner, because a plan without a named owner is a wish with a spreadsheet.
None of this requires new demand. It reroutes demand the practice already earns in December into the months it currently forfeits.
Run the Same Diagnosis on Your Business
The walkthrough above used a fictional practice, but the tools accept real inputs and return the same class of findings. The VWCG Strategic Assessment takes about 10 minutes, covers nine assessment areas, and returns a scored briefing with prioritized recommendations built from your own answers.
Seasonal businesses that treat the slow season as weather keep buying ads to change the forecast. The ones that treat it as structure build recall floors, revenue floors, and first-quarter plans, and then January stops being a surprise.
Kamyar Shah has led 650+ consulting engagements, including fractional COO, fractional CMO, executive coaching, and strategic advisory, producing over $300M in client impact across companies in the $1M-$50M range. He built the VWCG Strategic Assessment from the same diagnostic frameworks he uses in paid engagements.
Ready to assess your business?
Get clear visibility into your gaps with our free tools.
Start Free Assessment